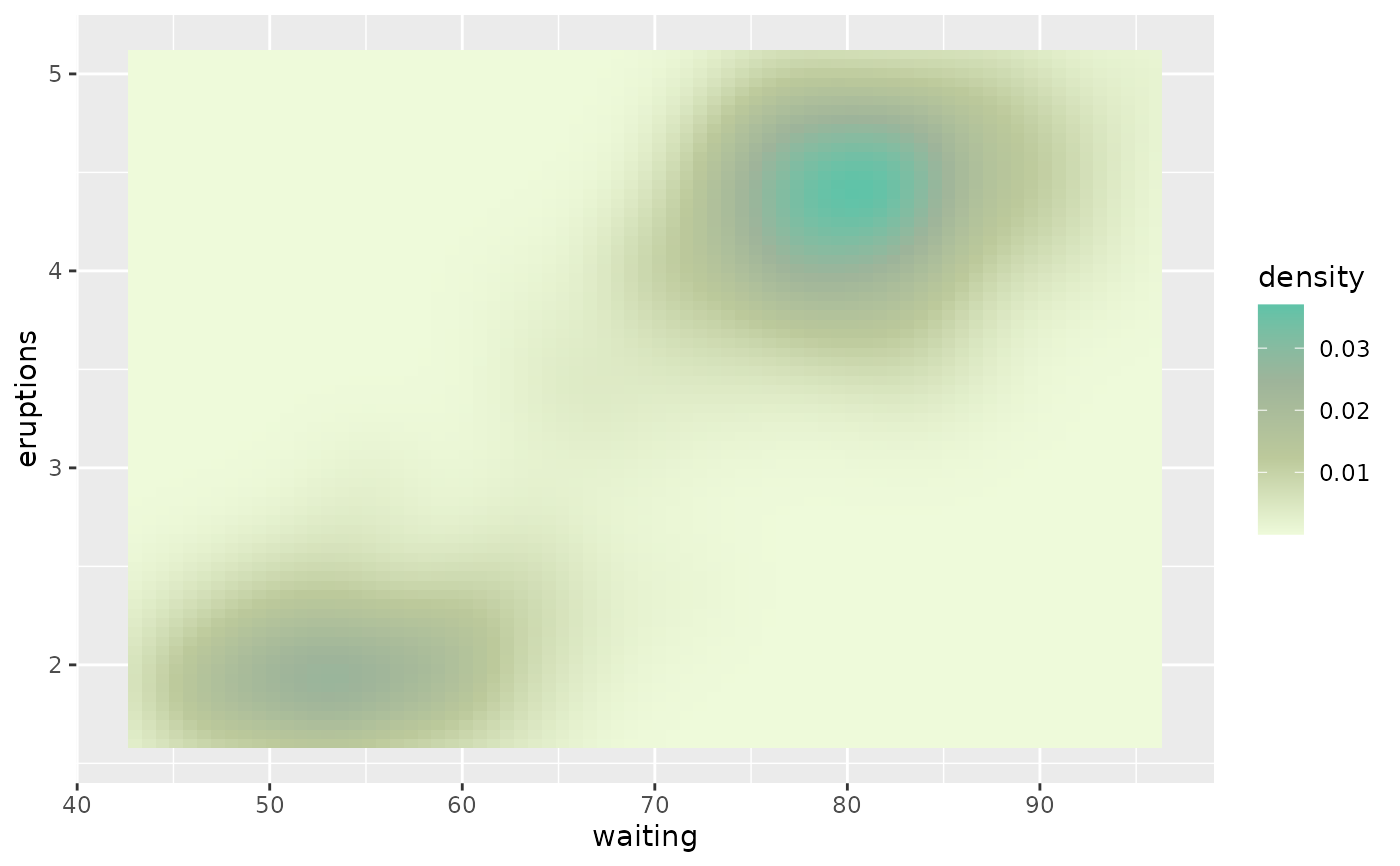
Color and fill scales that use a Glyos colorway palette. The _d variants
are for discrete data, the _c variants for continuous data, and
scale_colour_glyos() / scale_fill_glyos() choose between the two with
the discrete argument. scale_color_* spellings are aliases.
Usage
scale_colour_glyos_d(palette = "standard", reverse = FALSE, ...)

scale_fill_glyos_d(palette = "standard", reverse = FALSE, ...)

scale_colour_glyos_c(palette = "standard", reverse = FALSE, sort = FALSE, ...)

scale_fill_glyos_c(palette = "standard", reverse = FALSE, sort = FALSE, ...)

scale_colour_glyos(
  palette = "standard",
  discrete = TRUE,
  reverse = FALSE,
  sort = FALSE,
  ...
)

scale_fill_glyos(
  palette = "standard",
  discrete = TRUE,
  reverse = FALSE,
  sort = FALSE,
  ...
)

scale_color_glyos_d(palette = "standard", reverse = FALSE, ...)

scale_color_glyos_c(palette = "standard", reverse = FALSE, sort = FALSE, ...)

scale_color_glyos(
  palette = "standard",
  discrete = TRUE,
  reverse = FALSE,
  sort = FALSE,
  ...
)
Arguments
- palette
Name of a Glyos colorway. See
glyos_palette_names().- reverse
Logical. Reverse the order of colors in the palette?
- ...
Additional arguments passed on to
ggplot2::discrete_scale()(discrete) orggplot2::scale_colour_gradientn()/ggplot2::scale_fill_gradientn()(continuous).- sort
Logical, continuous scales only. Order the palette from darkest to lightest before building the gradient, so the scale reads as low-to-high. See
glyos_find_palettes()for palettes that suit this.- discrete
Logical. If
TRUE(default) build a discrete scale, otherwise a continuous gradient scale.
Details
Discrete scales draw the first n colors of the palette, where n is the
number of levels in the data. If the data has more levels than the palette
has colors, the palette is interpolated with grDevices::colorRampPalette()
so that every level still receives a distinct color; expect the result to be
less legible than the curated colors.
Examples
library(ggplot2)
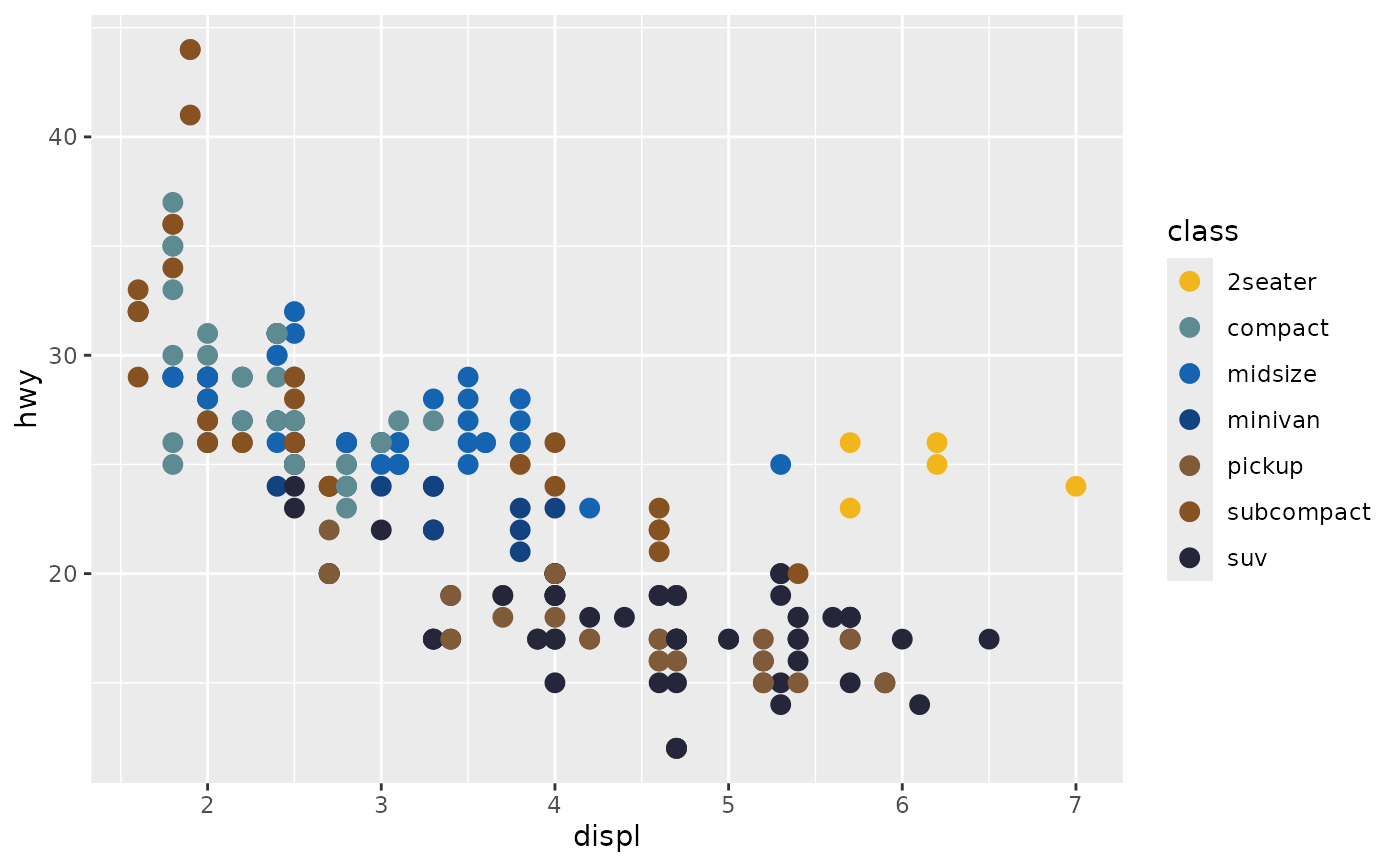
ggplot(mpg, aes(displ, hwy, color = class)) +
geom_point(size = 3) +
scale_colour_glyos("glyaxia")
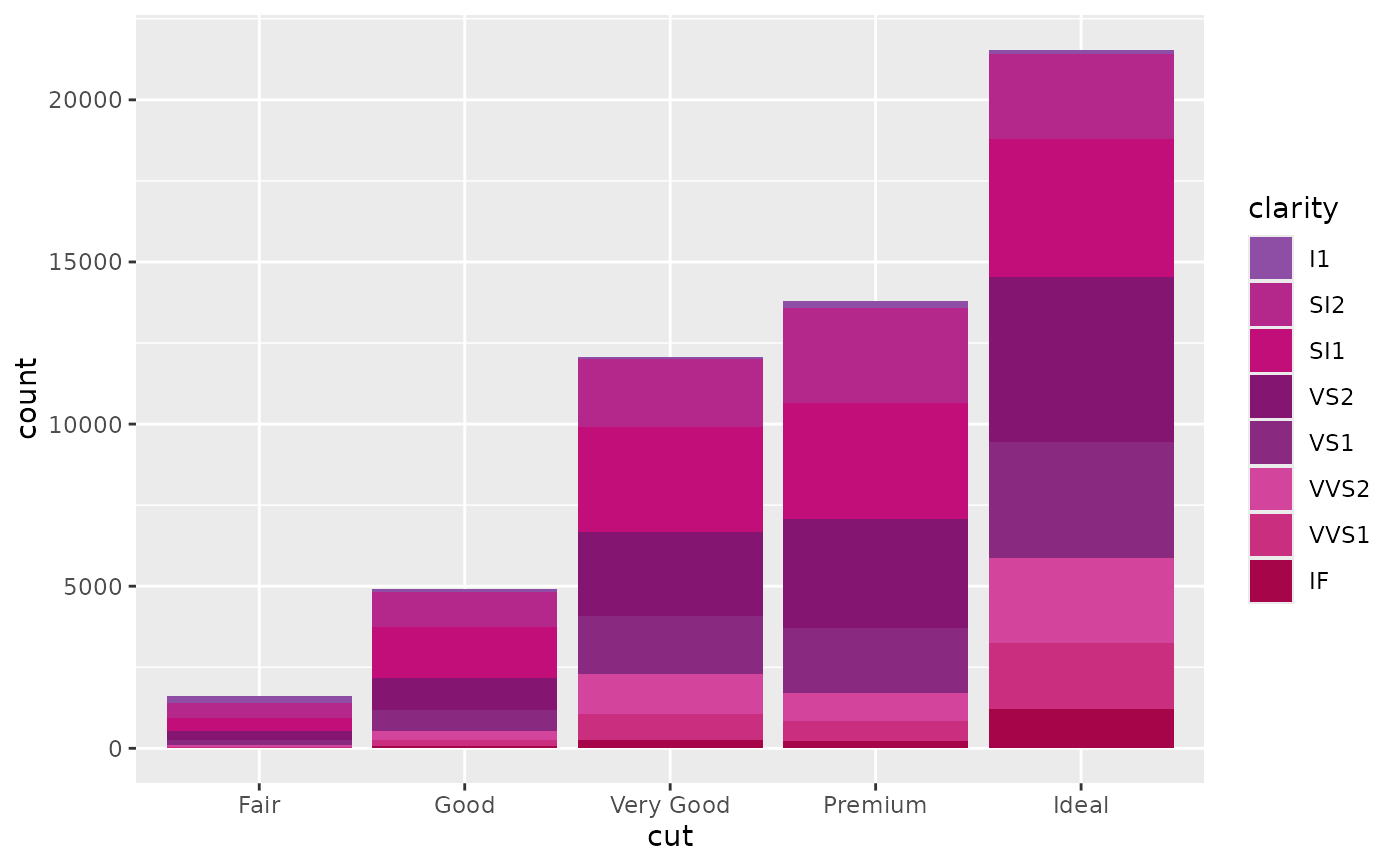
 ggplot(diamonds, aes(cut, fill = clarity)) +
geom_bar() +
scale_fill_glyos_d("gatekeeper")
 ggplot(faithfuld, aes(waiting, eruptions, fill = density)) +
geom_tile() +
scale_fill_glyos_c("spectre")